What you’ll need:
Any Kommo plan: Base, Advanced, Pro, Enterprise, or a 14-day trial
At least one incoming lead.
Permissions to access the report data.
Keep in mind:
If there is not enough historical data, the widgets may show a Not enough data for report message instead.
The incoming leads metrics are only visible to users who have explicit view permissions for the Incoming leads stage.
The Win-Loss analysis report shows how leads move through your pipeline, how long transitions take, and where opportunities are won or lost. Use it to review conversion performance and forecast potential sales.
Use cases
Spot bottlenecks in your pipeline by checking where leads spend the most time.
Track whether your team is improving lead velocity and response speed.
Compare active, closed, and all leads to understand how deal timing changes across the pipeline.
Use the filter to review performance by period, pipeline, manager, or source, depending on what you need to analyze.
How to view Win-Loss analysis
You don’t need to configure anything extra to use this feature. Once you start working with the leads, Kommo automatically starts collecting analytics. To open it, follow these steps:
Go to the Insights section in Kommo.
Click on Win-Loss analysis.
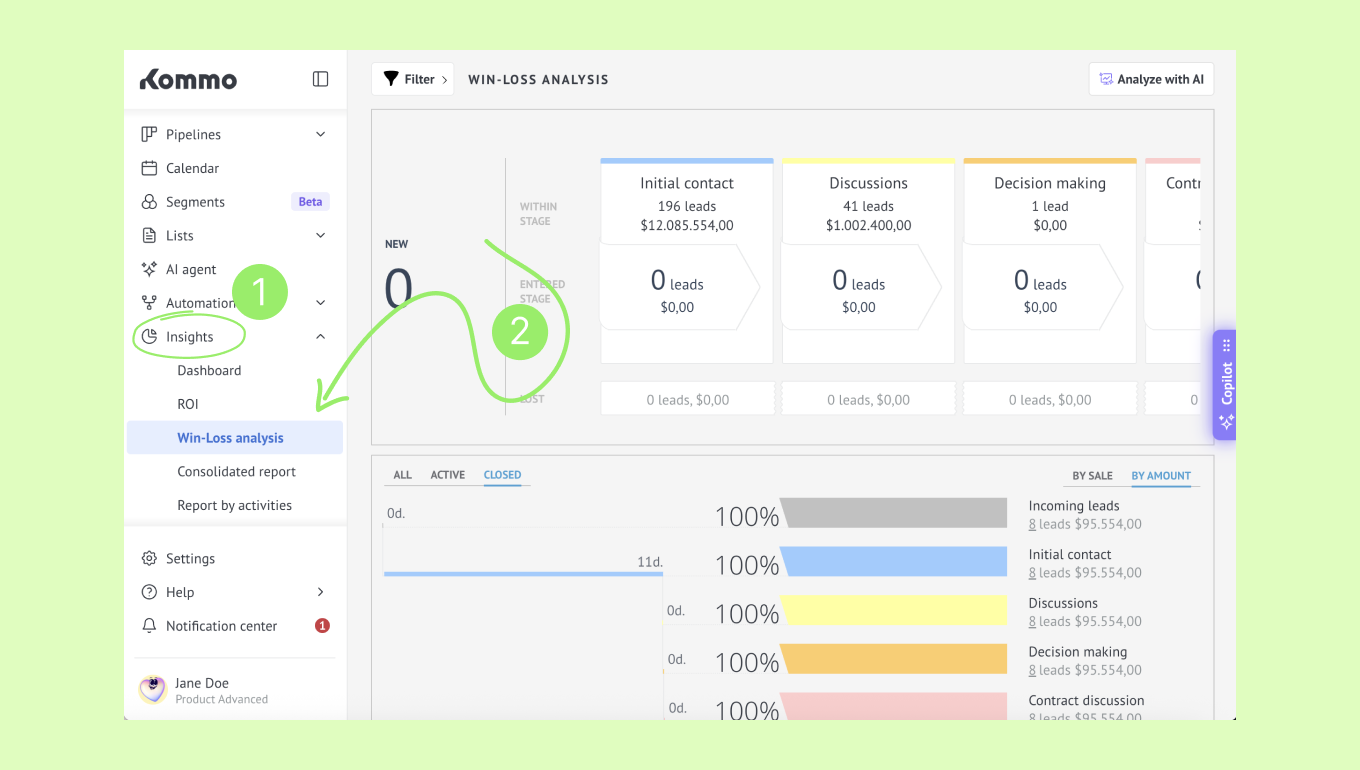
Tip: In the top-left corner, you’ll find a filter to refine the report.
How the Win-Loss analysis report works
Pipeline stage analysis
The first widget you see is the pipeline stage analysis. It visualizes how leads move through your sales pipeline during the selected reporting period. Each column represents a pipeline stage.
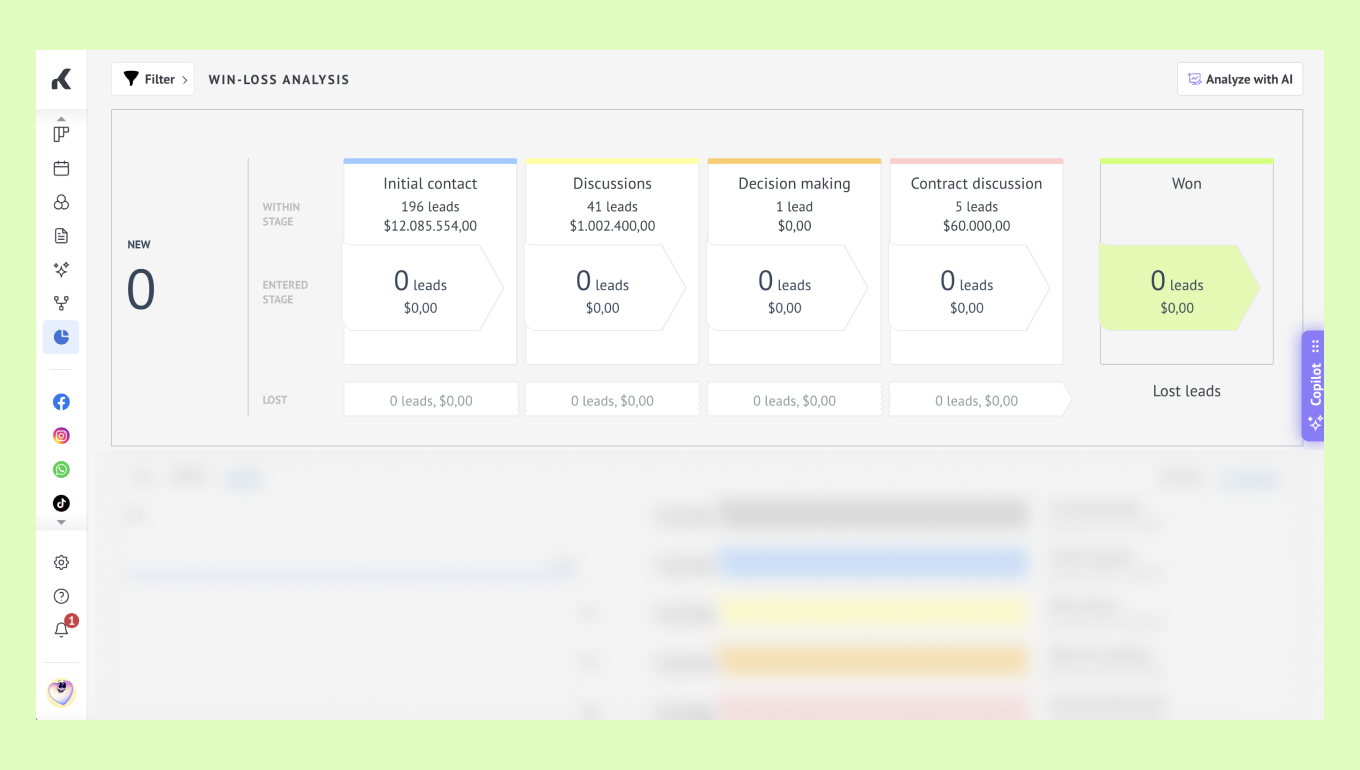
For each stage, the report shows:
Within stage — the number and total value of leads that are currently in this stage.
Entered stage — the number and total value of leads that entered this stage during the selected reporting period, regardless of whether they have already moved to another stage.
Note: Only those leads that entered the stage are counted. If the lead was created on stage, it won’t be shown.
Lost — the number and total value of leads that were marked as lost or closed while in this stage.
Tip: The values are interactive. You can click at any value and see all the associated leads.
By comparing these metrics, you can determine where leads are most likely to stall or be lost.
For example, if a stage has a high number of Entered stage leads but very few Within stage leads, it may indicate that leads move through this stage quickly. If the Lost value is high, that stage may represent a bottleneck in your sales process.
Tip: The pipeline analysis is interactive. Click the Entered stage value for any pipeline stage to open a table containing all leads that entered that stage during the selected reporting period.
Average lead life-cycle
The lead life-cycle analysis shows how long leads spend in your pipeline during the selected reporting period. Use this report to see where leads spend the most time, compare active and closed lead behavior, and identify stages that may need attention.
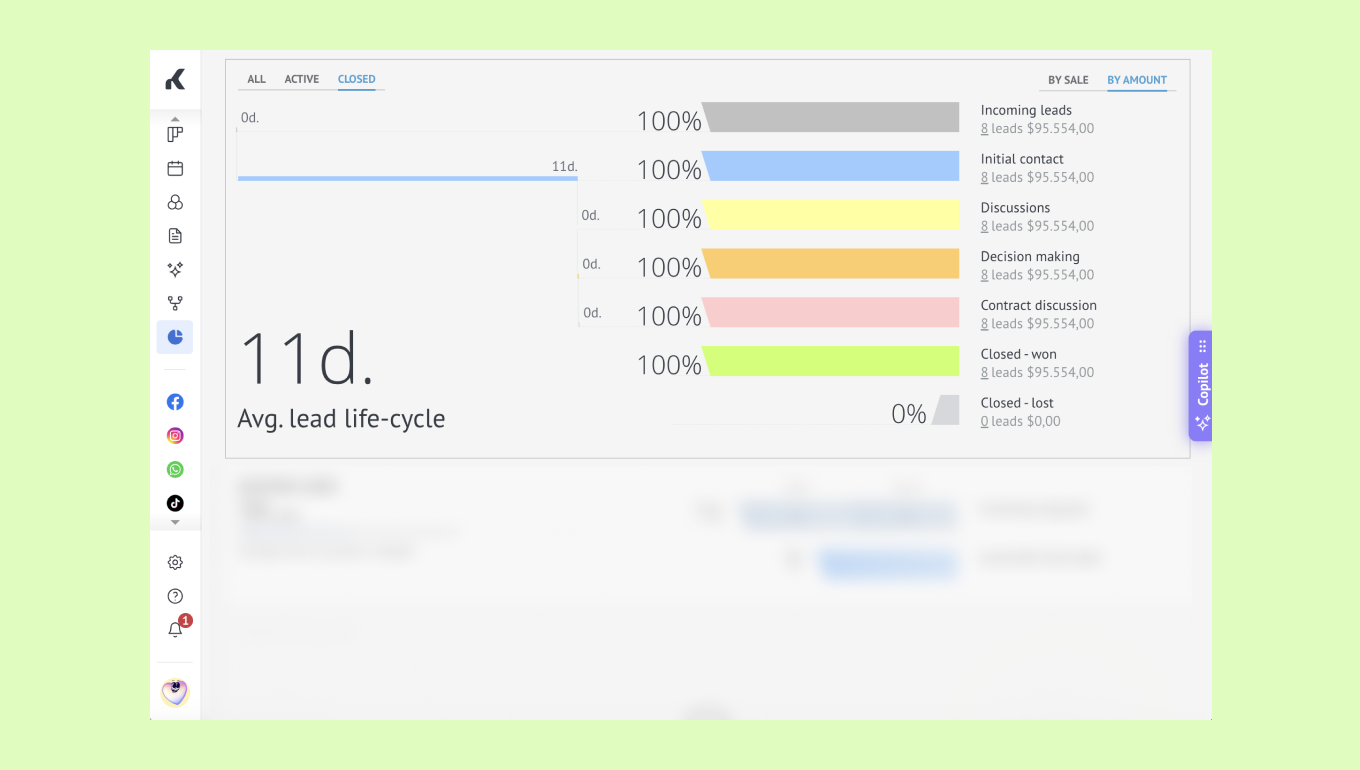
Tip: If one stage has a much longer duration than the others, it may indicate that leads are getting stuck there and require follow-up.
The main value in the widget shows the average lead life-cycle — the average amount of time leads stay in the pipeline.
The report can be viewed by lead status:
All — includes all leads.
Active — includes leads that are currently active.
Closed — includes leads that have already been closed.
Note: When a lead is closed for the first time, Kommo permanently locks that closing date. If you move the deal directly to another closed stage later, Kommo will not update the date unless you first move it back to an active stage or create a brand-new lead.
The chart breaks down the lead life-cycle by pipeline stage. Each stage shows how many leads are currently associated with it and their total value. You can switch between By sale and By amount to view the distribution either by the number of leads or by their total value.
The percentage bars on the right show how leads are distributed across pipeline stages.
Incoming leads
The Incoming leads widget shows how quickly incoming requests are processed and how many become leads during the selected period.
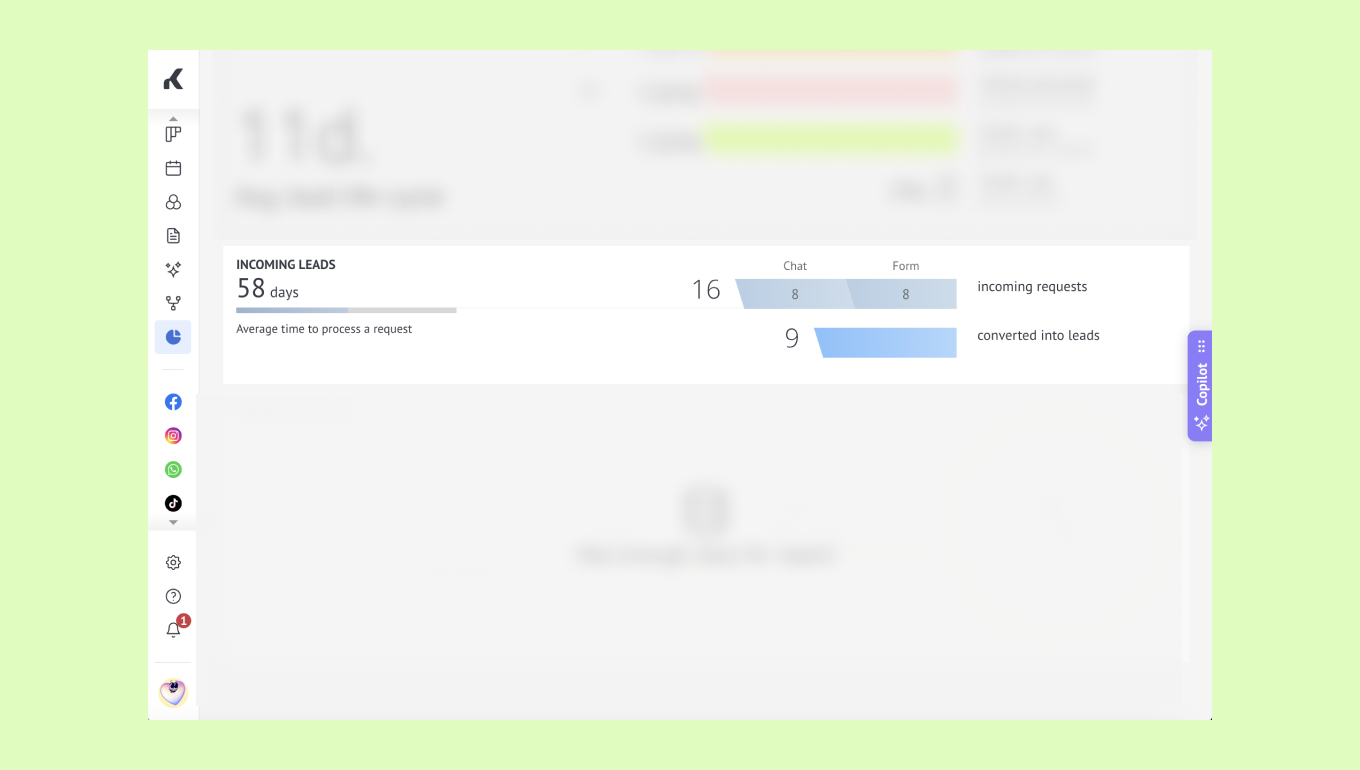
It includes:
Average processing time — The average time between receiving a request and accepting it as a lead.
Incoming requests — The total number of requests, grouped by sources such as chats, webforms, or email.
Converted leads — The number of incoming requests accepted as leads.
Use these metrics to compare lead sources, identify processing delays, and track request-to-lead conversion over time.
Prospective sales analysis
The Prospective sales analysis estimates how many active leads are likely to become Closed-Won and their potential value. The report predicts how many of your leads will convert based on the following historical data: the actual sales recorded and the number of leads passed into the closed-won lifecycle.
Note: Kommo gathers essential data as you use your account. Sales forecasts and prospective analytics will automatically unlock as your data grows.
It displays:
Active leads — The current number of open sales opportunities.
Forecast periods — Expected sales grouped by their estimated closing time.
Leads and value — The number and total value of leads in each period.
Expected sales — The total forecasted number and value of upcoming sales.
Use this forecast to estimate upcoming revenue, monitor pipeline health, and check whether enough leads are expected to close within your target timeframe.