What you’ll need:
Any Kommo plan: Base, Advanced, Pro, Enterprise, or a 14-day trial.
Permissions to access the report data.
Keep in mind:
The New lead metrics strictly track who created the lead, completely disregarding which manager is currently responsible for it.
The Won and Lost lead metrics strictly track who is currently responsible for the lead, disregarding who created or closed it.
The Report by activities helps you monitor your team's sales activity. It summarizes key metrics for each Kommo user, including lead management and sales results, making it easy to compare performance across your team.
Use cases
Compare team performance — review key lead metrics across all CRM users to identify top performers and balance workload.
Analyze individual productivity — drill down into a user's dashboard to evaluate their leads, clients, contacts, tasks, and CRM activity.
Monitor lead progression — track how leads move through different statuses to understand pipeline performance better.
Track CRM activity — review user actions such as lead and contact creation, pipeline updates, notes, emails, completed tasks, and calls to measure CRM engagement.
Evaluate task management — analyze activities by task type and completion status to identify overdue work and improve task execution.
How to view the Report by activities
To access the Report by activities, follow these steps:
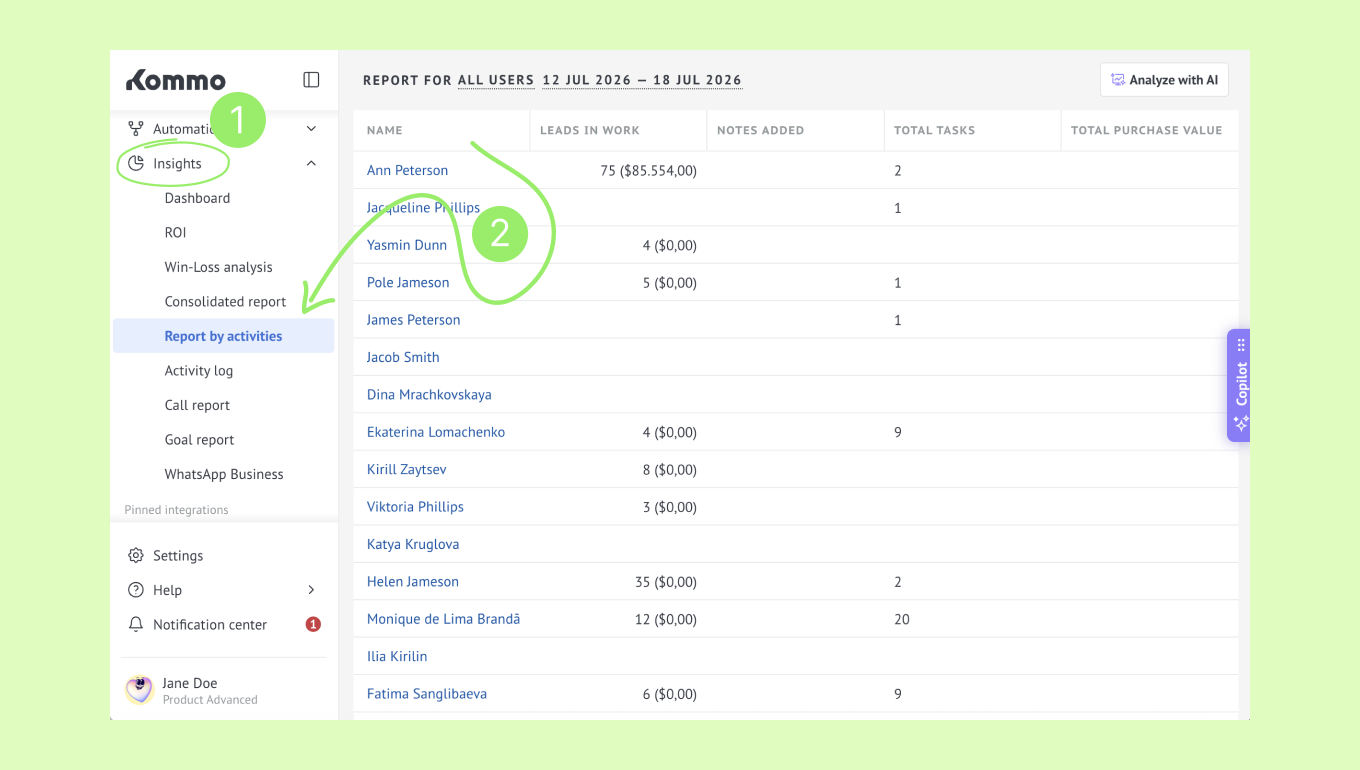
Go to the Insights section in Kommo.
Click on Report by activities.
What you'll find in the Report by activities
This report covers all the essential activities of your team throughout the set period of time. It consists of two layers:
Team overview
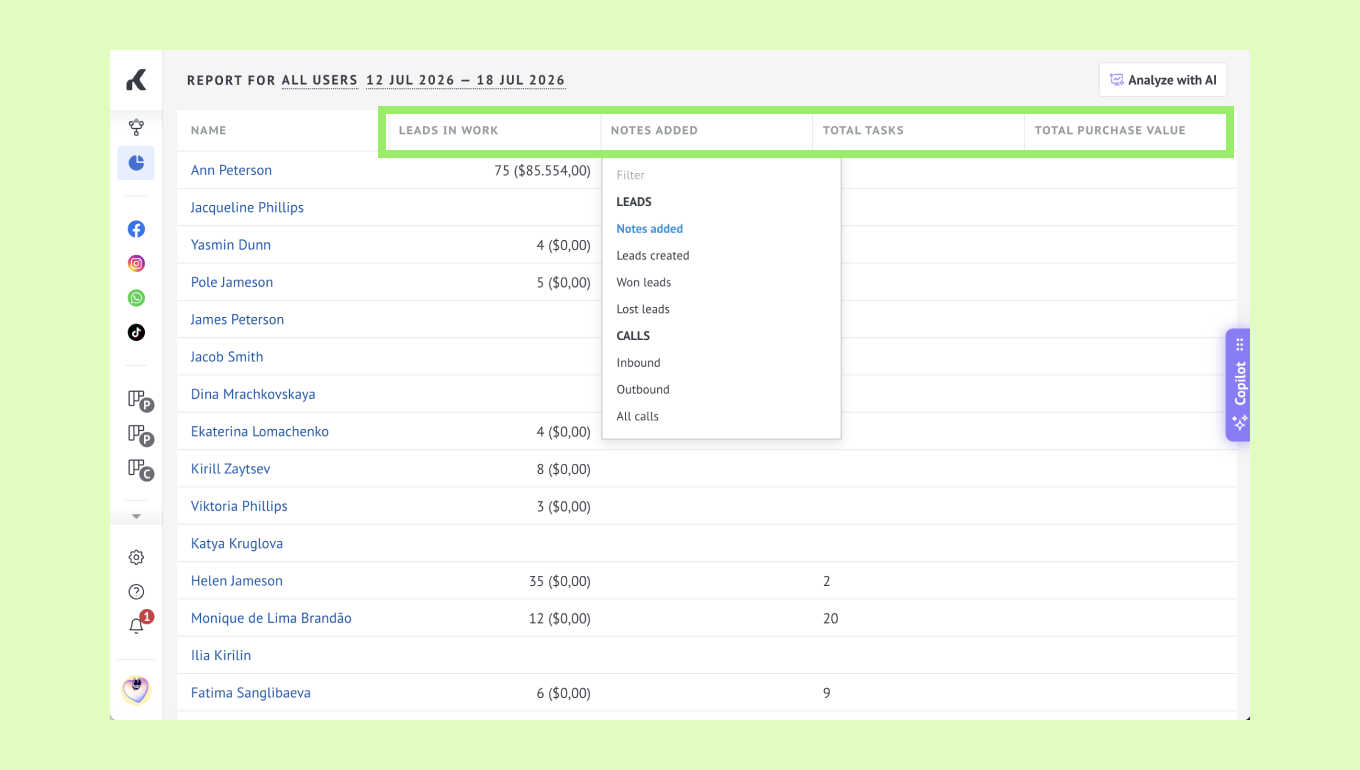
The summary row at the top shows the selected user’s activity across key metrics.
Tip: Click any column header to choose which metric it displays.
User details
Here you can explore detailed statistics for an individual user.
You can access this layer of the report by following the steps:
Open the report.
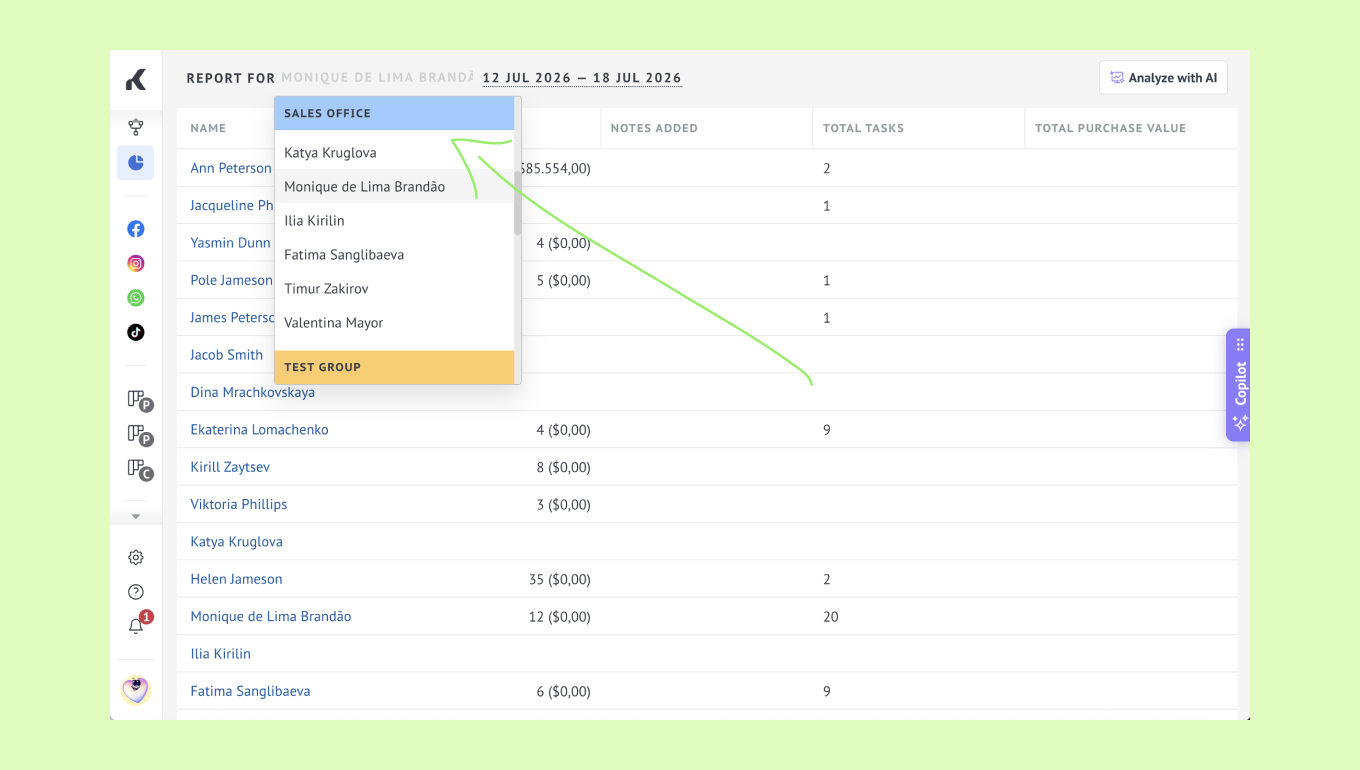
Click any user in the report.
Alternatively, select a user from the filter at the top of the page.
The individual dashboard includes several widgets that provide a detailed breakdown of the selected user's activity:
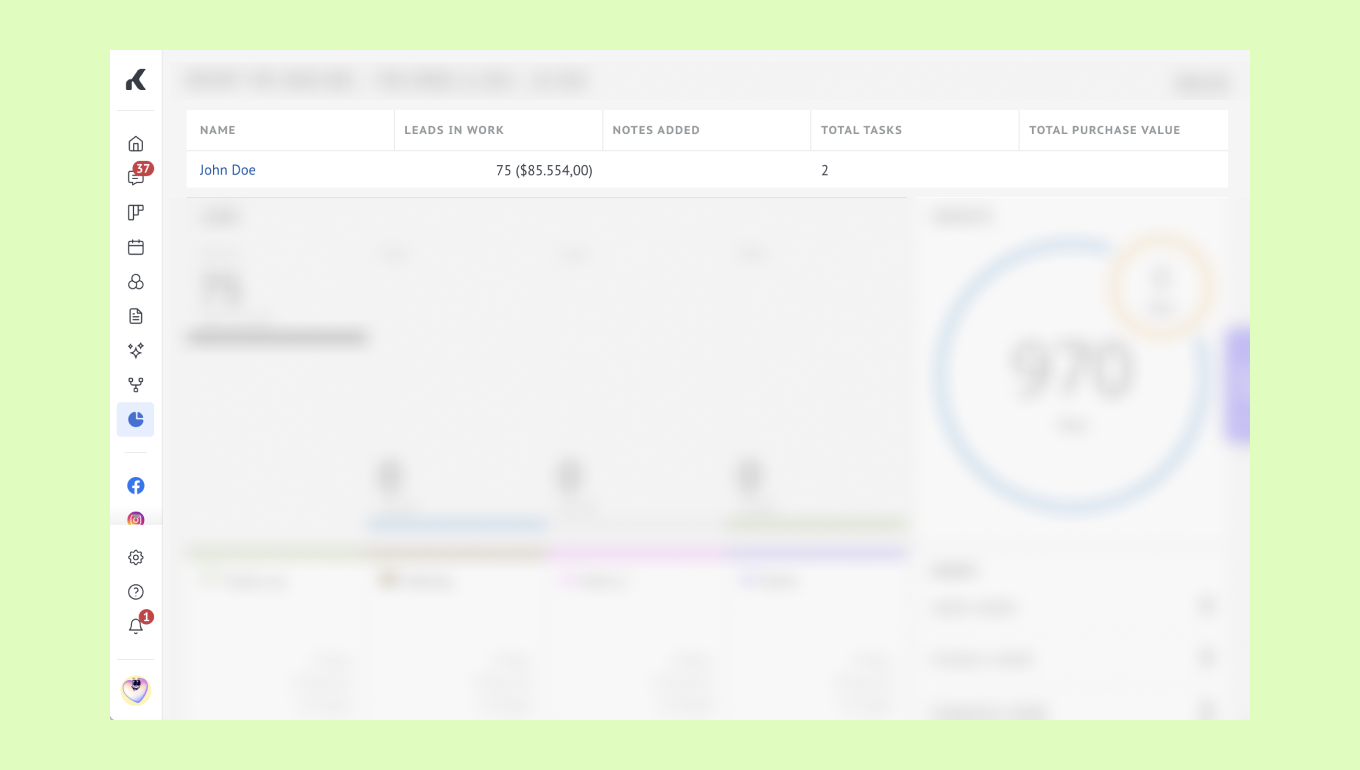
The top line summarizes the selected user’s activity in one table.
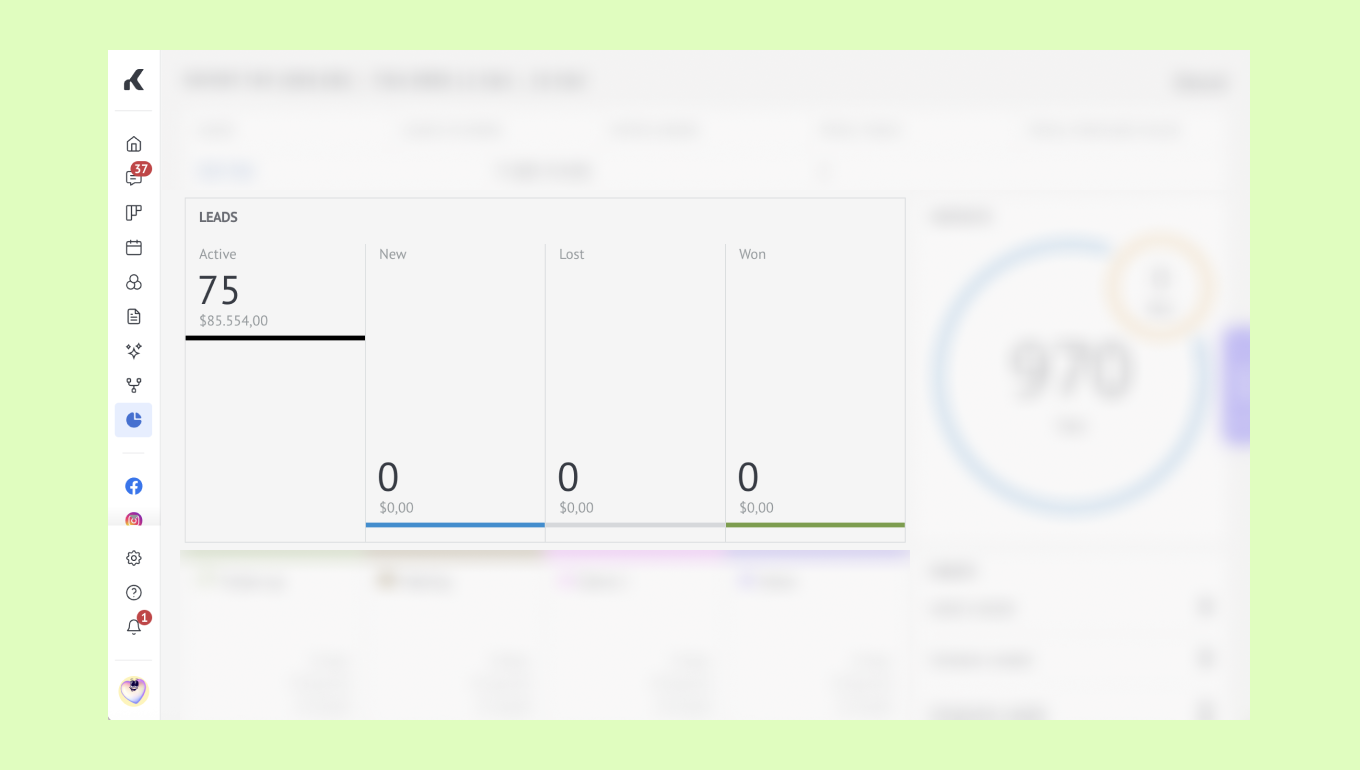
Leads — summarizes the user's leads by status (Active, New, Lost, and Won), including the number of leads and their total value for each category.
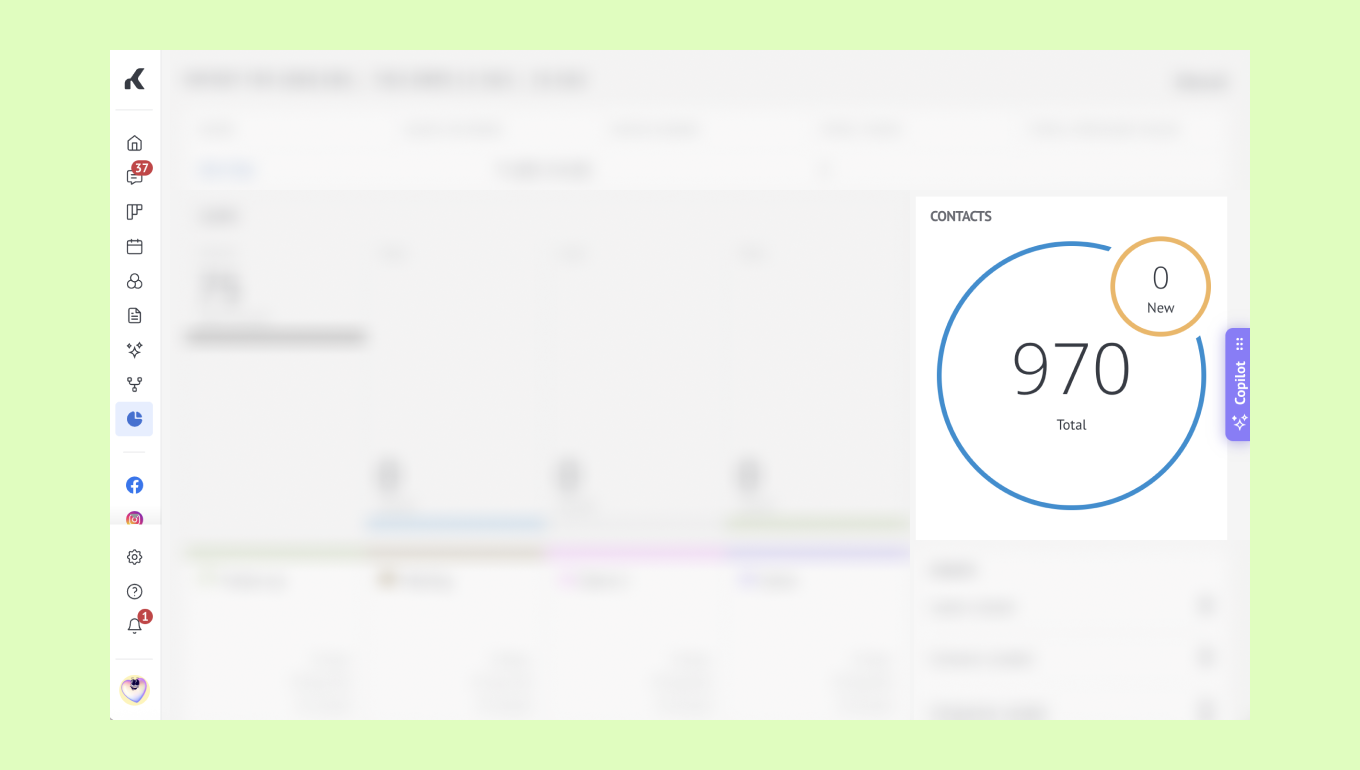
Contacts — shows the total number of contacts assigned to the user, along with the number of newly created contacts during the selected reporting period.
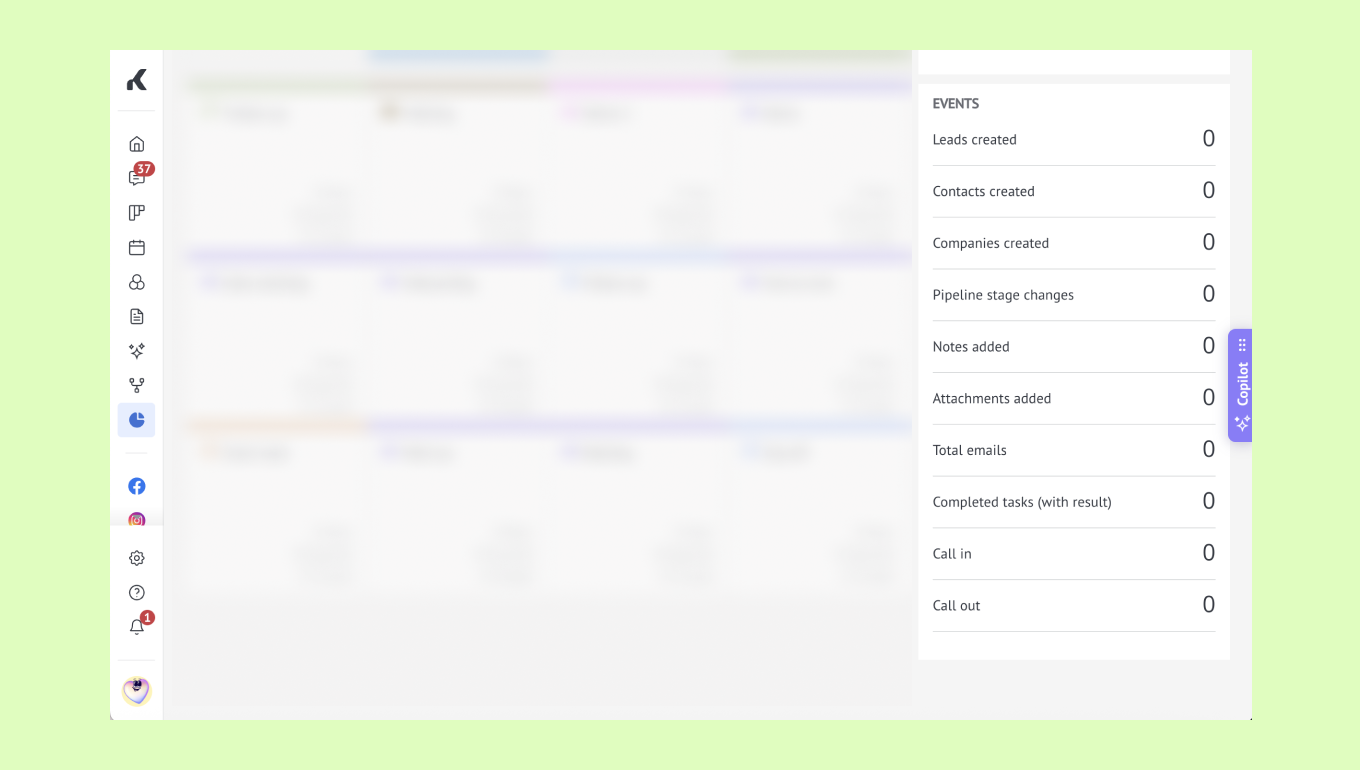
Events — summarizes actions performed by the user, including created leads, contacts, and companies, pipeline stage changes, notes, attachments, emails, completed tasks, and inbound and outbound calls.
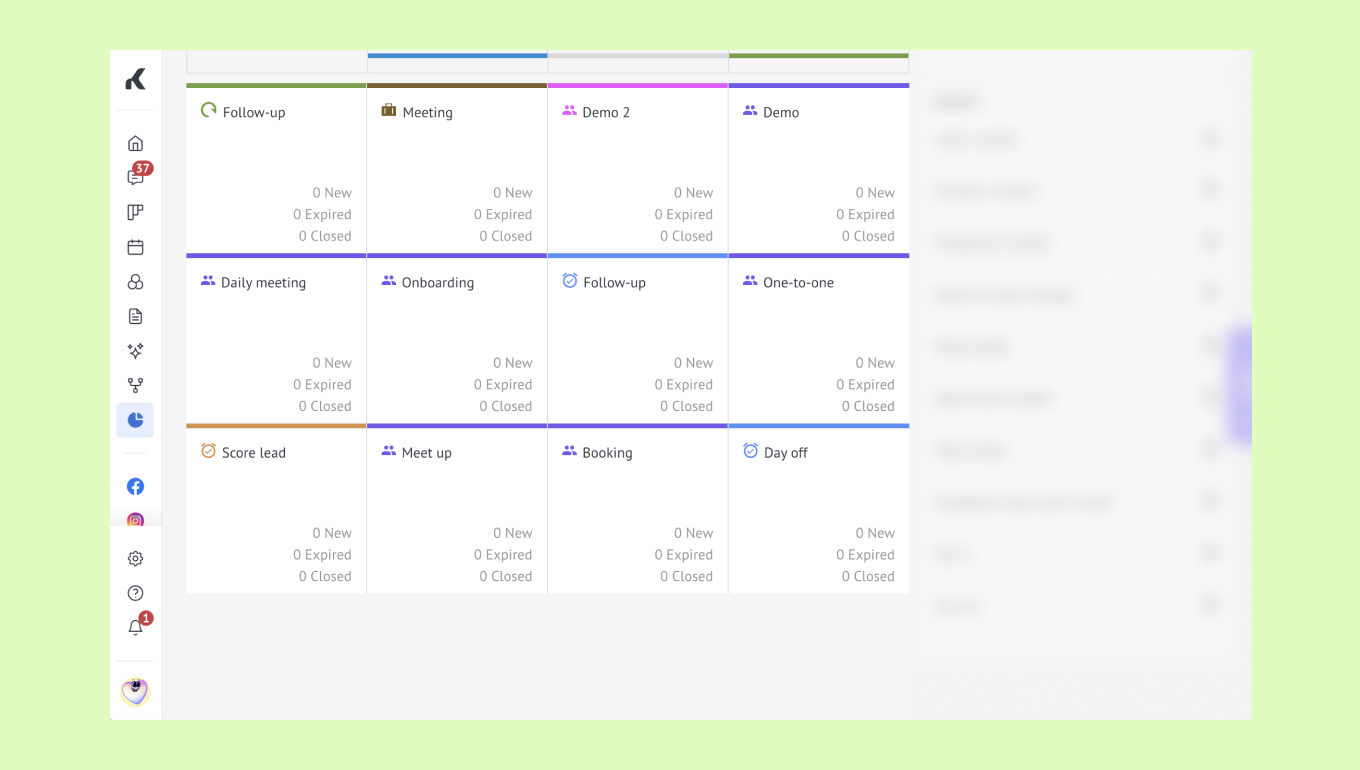
Tasks — breaks down the user's activities by task type. For each task type, the report displays the number of New, Expired, and Closed tasks, making it easy to monitor task completion and workload.