What you’ll need
A Kommo account on one of these plans: Advanced, Enterprise, or Trial.
Admin rights — only admins can create and track broadcasts.
At least one WhatsApp broadcast sent from Kommo (Other channels are supported but may have limited status data).
Keep in mind
Statistics start collecting once the broadcast is sent.
Data is shown at the message level, not at the lead level. This means if one lead receives multiple messages (for example, to two phone numbers), each message is counted separately for accurate delivery and cost tracking.
Broadcast statistics let you track real message performance – showing how many messages were sent, delivered, read, failed, and replied to.
How to analyze your broadcast statistics
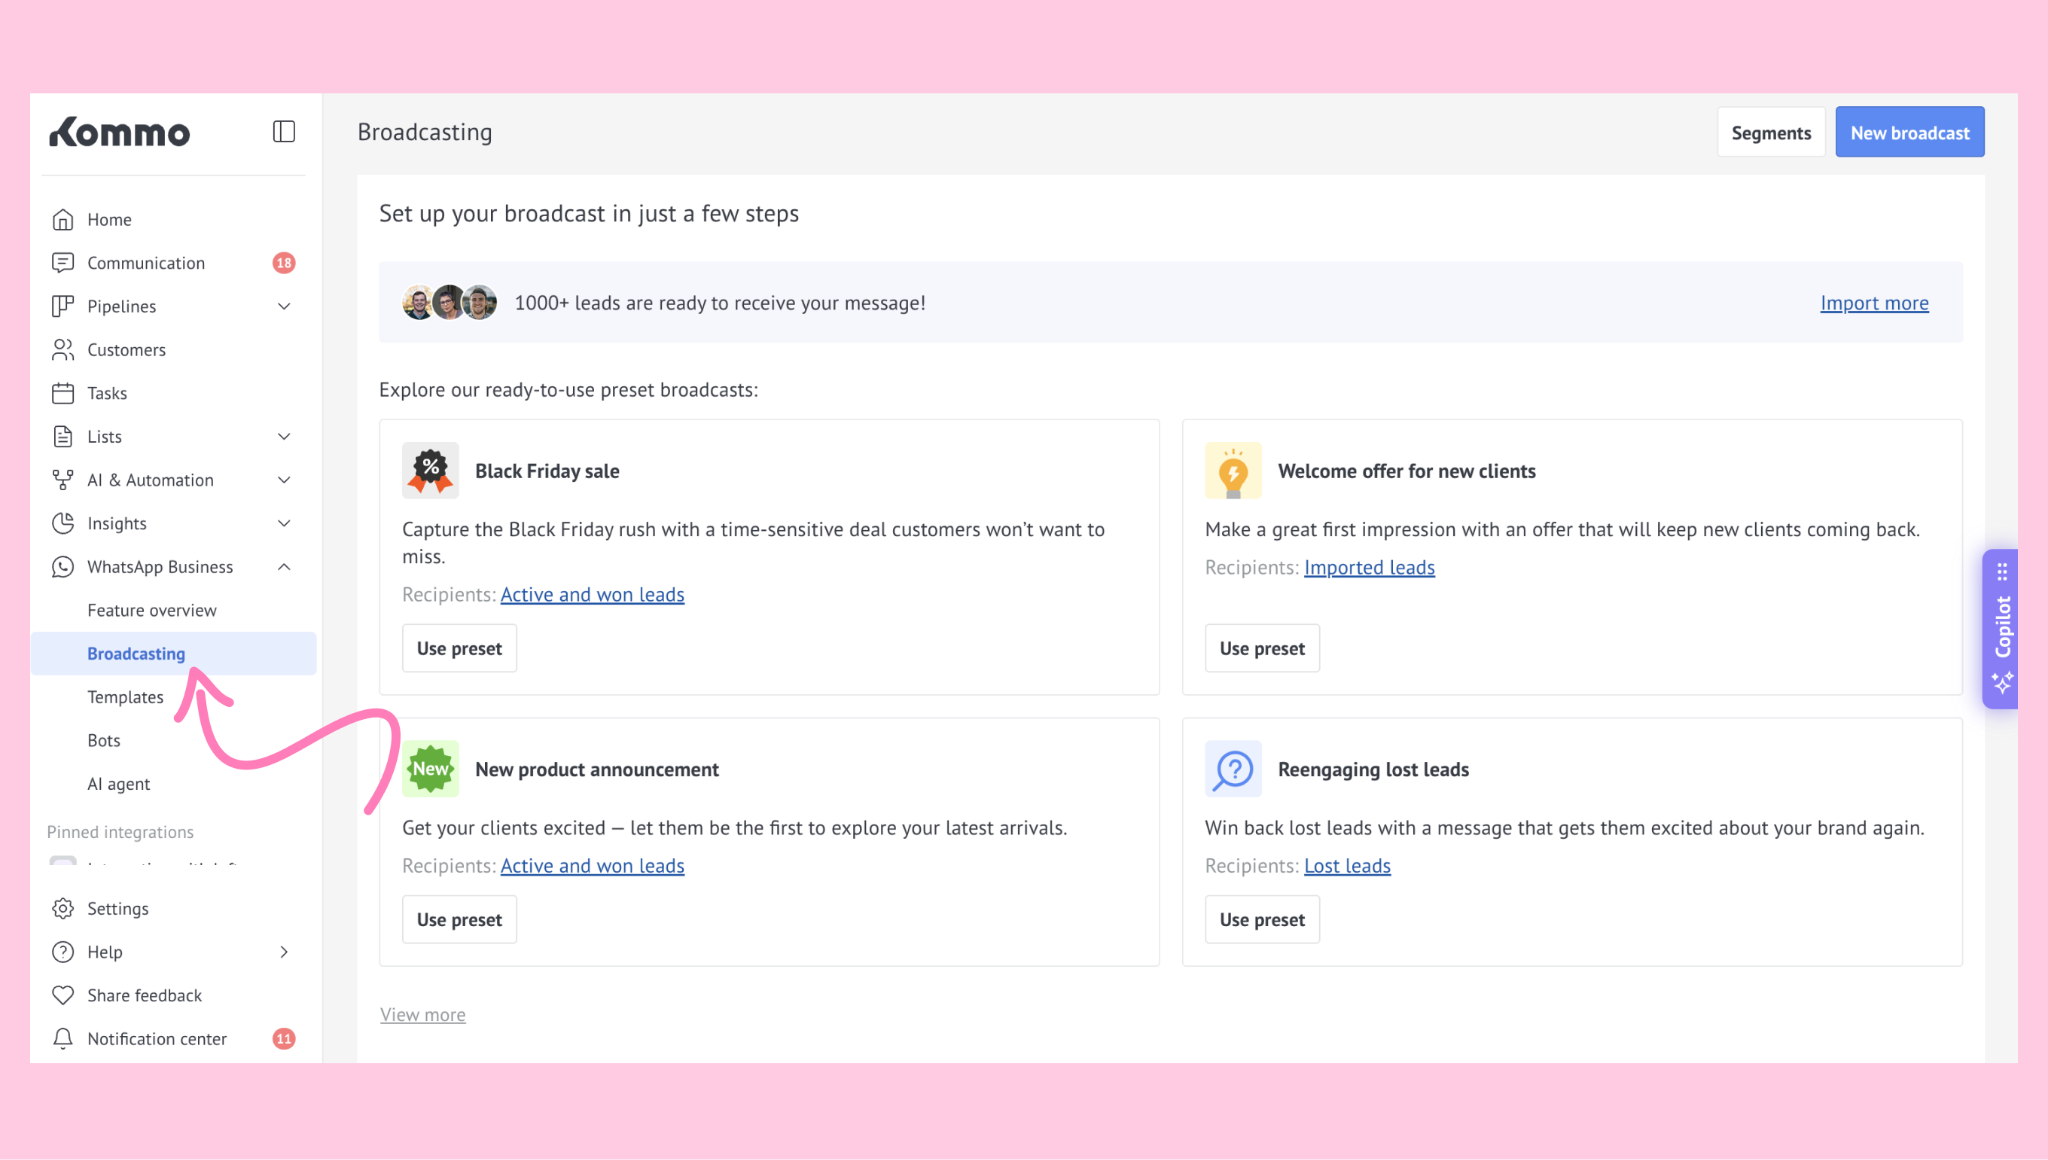
Open WhatsApp Business → Broadcasting.
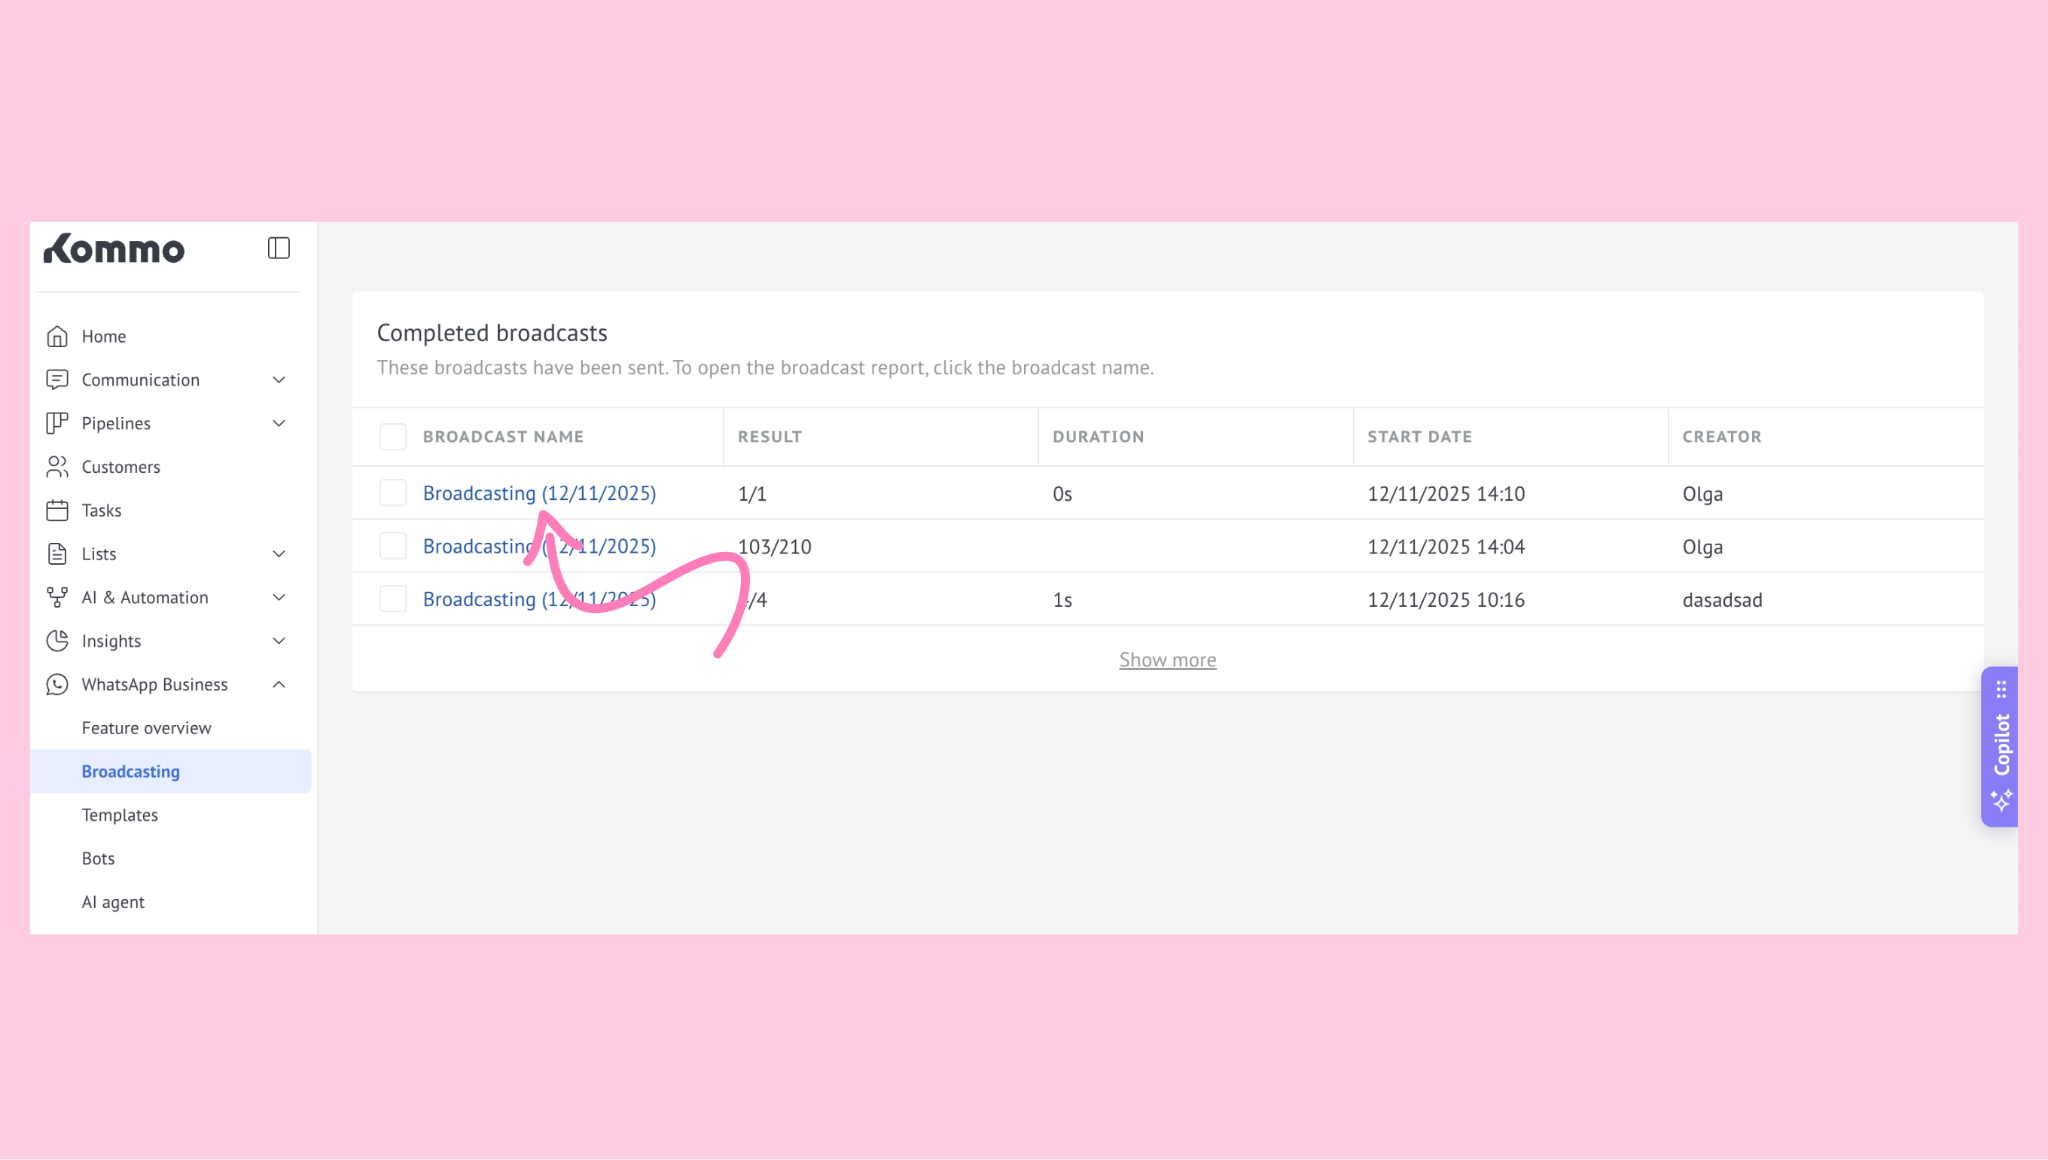
Scroll to the Completed broadcasts section. Find the broadcast you want to analyze and click on it.
3. The broadcast's statistics will open:
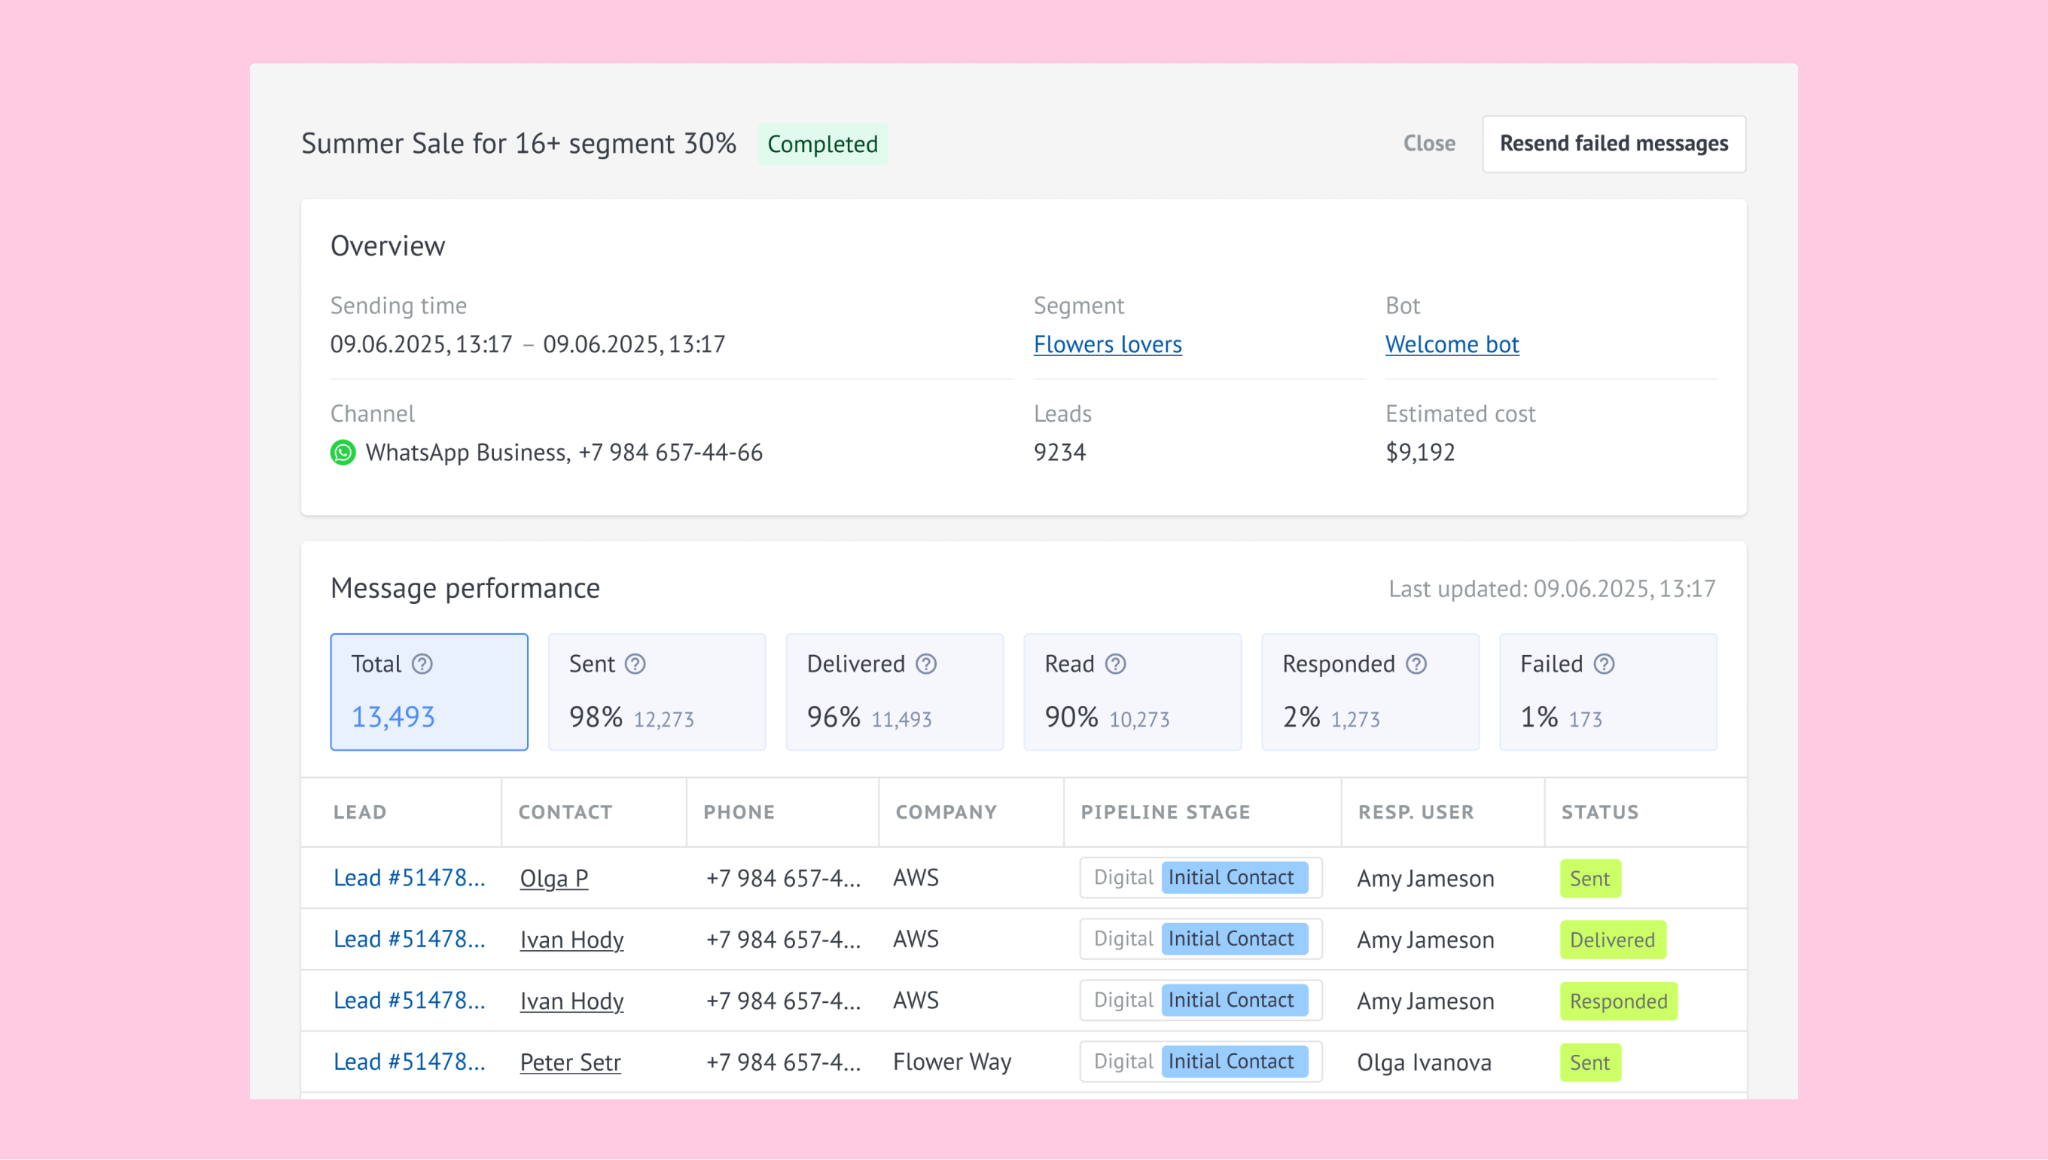
The report shows message-level results grouped by status: Total, Sent, Delivered, Read, Responded, and Failed.
Note: If you send a broadcast, you will be redirected to the Broadcasting page and the statistics modal will open immediately.
Understanding the statistics
Each metric in the report represents a key part of your broadcast performance.
Here’s how Kommo calculates and interprets them:
Metric | Description | Calculation / Reference | Value explained |
|---|---|---|---|
Total | Total number of messages successfully sent to contacts with a valid phone number or connected social profile. | – | Reflects broadcast audience size |
Sent / Sent Rate | Messages successfully accepted by the channel (e.g., WhatsApp) and not failed at the sending stage. | Sent Rate = Sent / Total × 100% | High = active, valid audience |
Delivered / Delivery Rate | Messages that reached the recipient’s device. | Delivery Rate = Delivered / Sent × 100% | High = stable message delivery |
Read / Read Rate | Messages opened by the recipient (if the channel supports read receipts). | Read Rate = Read / Delivered × 100% | High = engaging message content |
Failed / Bounce Rate | Messages that couldn’t be sent or delivered due to invalid numbers, blocking, or technical issues. | Bounce Rate = (Failed to send + Failed to deliver) / Total × 100% | Low = clean data, few invalid numbers |
Responses / Response Rate | Number of recipients who replied to the broadcast. Only the first reply counts. | Response Rate = Responses / Delivered × 100% | High = strong engagement |
Note: Read rate may be unavailable for some channels (e.g., Slack) or if users disable read receipts in WhatsApp.
You can see which leads fall under each metric:
Click a status (e.g., Failed, Delivered, or Response) in the statistics list.
Kommo opens a detailed Leads view filtered by that category.
From here, you can inspect contact details, message history, and so on.
Tip: If your statistics don’t load or display incorrect values, try refreshing the report or check for integration errors.
Cost tracking for WhatsApp Business
When your broadcast uses WhatsApp Business, Kommo also displays Estimated cost — the total amount billed by Meta for delivered messages. This helps you connect your broadcast performance with its actual spend and ROI. Learn more about WhatsApp Business pricing rules.
Tips & best practices
Keep your contact data clean to minimize Failed and boost Sent/Delivery rates.
Review Read and Response sections to understand how engaging your message is and adjust your content or timing to improve results.
Create separate broadcasts per channel to compare performance clearly.
Kommo refreshes your broadcast stats each time you reopen the statistics modal. The timestamp below the report shows when the data was last updated.
If you need more help with setup or troubleshooting, feel free to reach out to our support chat or contact us via WhatsApp. You can also hire a Kommo partner to do all the hard work for you.
Not a user yet? Sign up for our 14-day free trial or book a live demo.